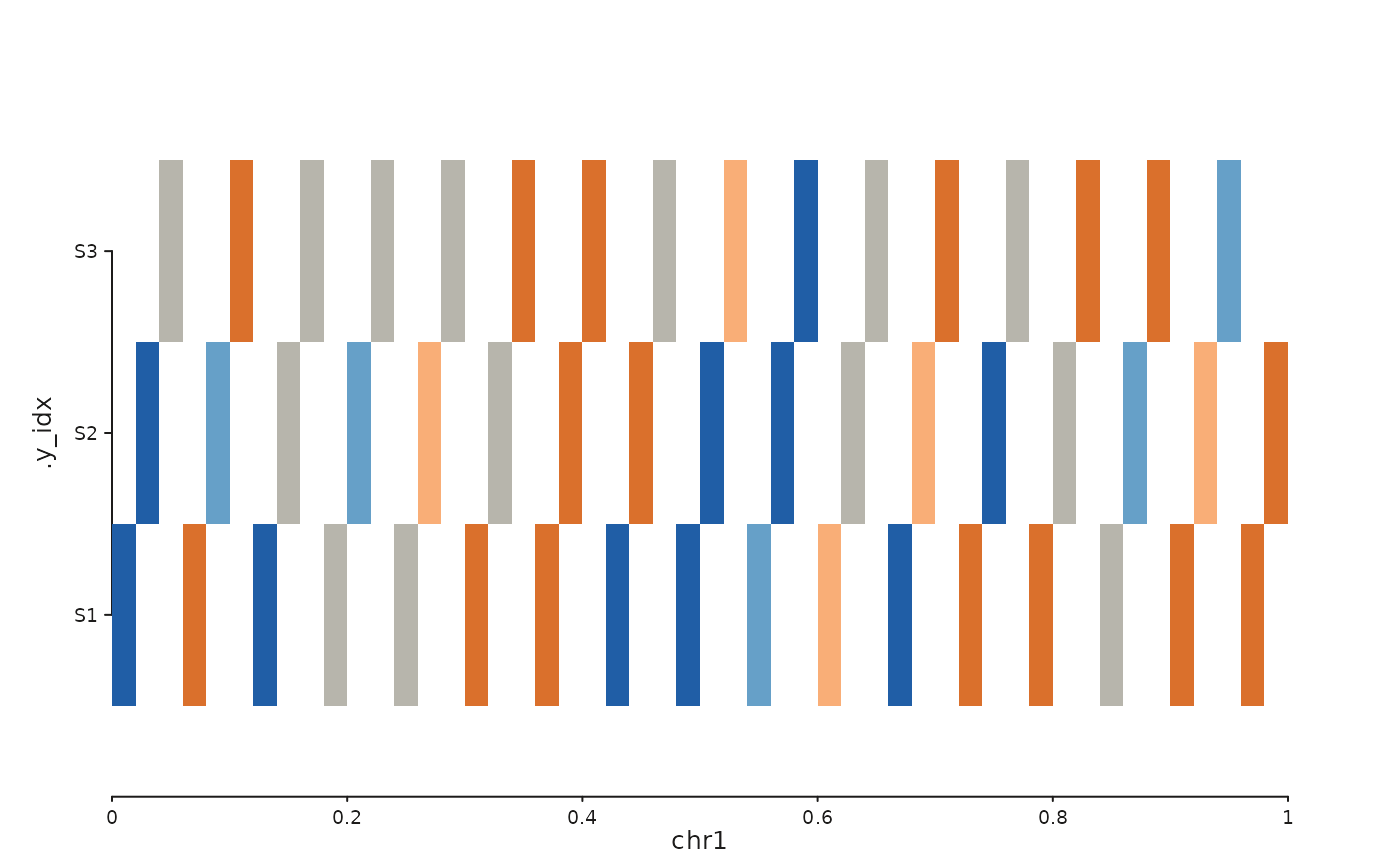
Builds a seq_plot() with a single track arranging per-sample CN
calls as a heatmap: samples are placed on the y-axis (top to bottom
according to sample_order), genomic windows along the x-axis, and
each bin is a tile coloured by CN state.
Usage
seq_cn_heatmap(
  data,
  windows,
  sample_col = NULL,
  cn_col = NULL,
  state_colors = NULL,
  sample_order = NULL,
  bins = NULL,
  track_height = 3,
  track_id = NULL,
  ...
)
Arguments
- data
A
GRanges(long format) or numeric matrix.- windows
A
GRangesof genomic view windows.- sample_col
Name of the mcols column giving sample identity. Auto-detected from
c("sample", "sample_id", "Sample", "id")whenNULL.- cn_col
Name of the mcols column giving integer CN state. Auto- detected from the same candidates as
seq_copynumber().- state_colors
Named character vector keyed by CN state string. Defaults to the
seq_copynumber()palette.- sample_order
Character vector of sample names in display order (top to bottom). When
NULL, samples are sorted alphabetically.- bins
Optional
GRangesgiving the genomic position of each matrix column; required whendatais a matrix.- track_height
Relative track height.
- track_id
Character
track_idfor the generated track.- ...
Additional arguments forwarded to
seq_track().
Details
Data may be supplied either as a long-format GRanges with one row
per (sample, bin) carrying sample and cn mcols columns, or as a
numeric matrix (rows = samples, cols = bins) plus a bins GRanges
giving the genomic position of each column (passed via ...).
Matrix input requires the matrix argument to have sample names as
rownames.